
Section VI · Supply & demand
The market that supply cannot balance
Price quadrupled; mine output rose two percent. Gold's supply curve is nearly vertical — which is why demand shocks land on price.
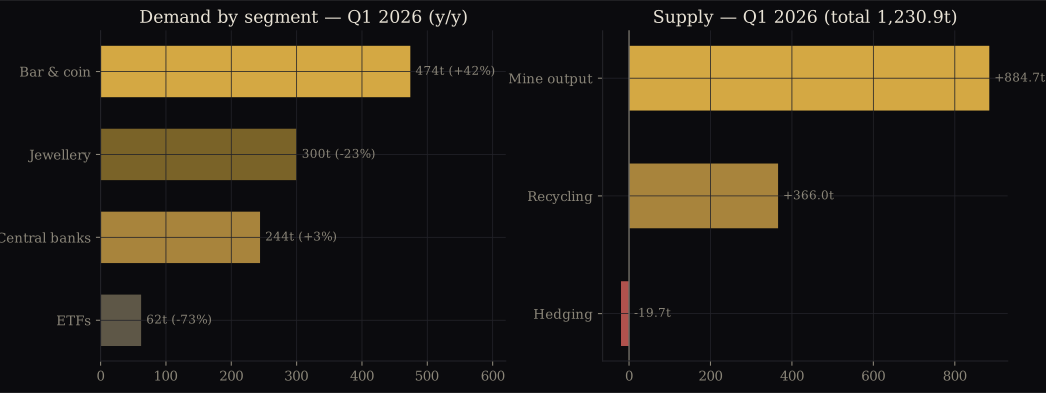
2025 delivered record mine production of ~3,815t — and that record represents growth of just 2%[2]. Q1 2026 set a first-quarter record at 884.7t, also +2%[1]. This is the structural fact that distinguishes gold from every industrial commodity: a 4× price move cannot summon meaningful new supply inside a half-decade. Mines take 10–15 years from discovery to pour, grades decline, and the all-in sustaining cost of the industry has itself inflated to a record $1,706/oz (+20% y/y)[3] as royalties and inputs ride the gold price up. The two elastic valves — recycling and jewellery — do respond, and their response is worth reading closely.
Recycling rose only 3% in 2025 against a 44% average-price increase — the WGC itself called the muted response a surprise[2]. Indian households pledged jewellery as collateral rather than selling it; Western flows hit refining-capacity limits in Q1 2026[1]. Jewellery demand fell 23% y/y[4] — the classic price-rationing that historically marks bull markets rather than ending them, because rationed jewellery demand returns on every dip and acts as a floor-builder. Net: above-ground stock turns over so slowly that the marginal price-setter is always the investor and the official sector, never the mine. Section IV's flows are the whole game; this section explains why.
Mine output FY2025
3,815t
All-time record — and only +2% y/y
Industry AISC Q4 2025
$1,706
Record; +20% y/y — but margins still ~$2,400+/oz
Recycling FY2025
+3%
vs +44% avg price — remarkably inelastic
Q1 2026 total supply
1,231t
+2% y/y — coincidentally equal to total demand
Q1 2026 — demand segments vs supply composition
WGC / Metals Focus · demand left (y/y change), supply right
The cost floor
Why AISC matters only in the crash case
The marginal-cost floor argument — price can't sustainably trade below the cost of producing the marginal ounce — sits at roughly $1,700–1,800 today[3], less than half of even our bear scenario. That gap is the measure of how much of today's price is monetary premium rather than commodity economics. It also means AISC offers no support anywhere near current levels: in a true demand collapse, the first economic backstop from the supply side is thousands of dollars down. The practical floors are behavioral, not geological — central-bank bids, jewellery re-entry, and bargain-hunting Asian retail. Those floors held at $4,170 in June. Whether they hold defines the bear band in Section VII.
Sources & citations