
Section II · Price history
Six regimes in fifty-five years
Gold does not trend — it regime-shifts. Decades of nothing, then a re-rating that happens faster than most allocators can respond to.
The long chart is the single most important exhibit in this study. Gold's 55-year history is not one market — it is six distinct regimes, each defined by a macro-political arrangement, and each transition violent[1]. An investor who bought the 1980 top waited 27 years to break even in nominal terms — and never has in real terms at any point before 2008. An investor who dismissed gold in 2000 after twenty dead years missed a seven-fold re-rating. The lesson the data forces on you: the right question is never "what will gold do this year" — it is "which regime are we in, and what would end it?"
Gold since 1971, log scale
LBMA monthly · toggle regime shading · hover for prices
| Years | Regime | Move | What defined it |
|---|---|---|---|
| 1971–1980 | Post-Bretton Woods bull | $35 → ~$850 (×24) | Dollar leaves gold standard; double-digit inflation; oil shocks; negative real rates |
| 1980–2001 | Disinflation winter | −70% nominal, −85% real | Volcker's 15%+ rates restore dollar credibility; two decades of disinflation; CBs sell gold |
| 2001–2011 | Secular bull I | $256 → $1,895 (×7) | Dot-com bust, 9/11, QE1/2, weak dollar, China demand emerges; CBs flip from sellers to buyers (2010) |
| 2011–2015 | Taper bear | −45% | Real yields normalize on taper talk; dollar bull market; Western ETF liquidation |
| 2015–2022 | Recovery / pandemic | $1,050 → ~$2,000 | Negative global real yields; pandemic QE; gold tracks TIPS almost perfectly |
| 2022–now | Reserve-freeze regime | $1,900 → $5,405 peak | Russia reserve freeze; CBs buy ~1,000t/yr; gold decouples from real yields; East leads |
Pattern recognition
What the cycles agree on
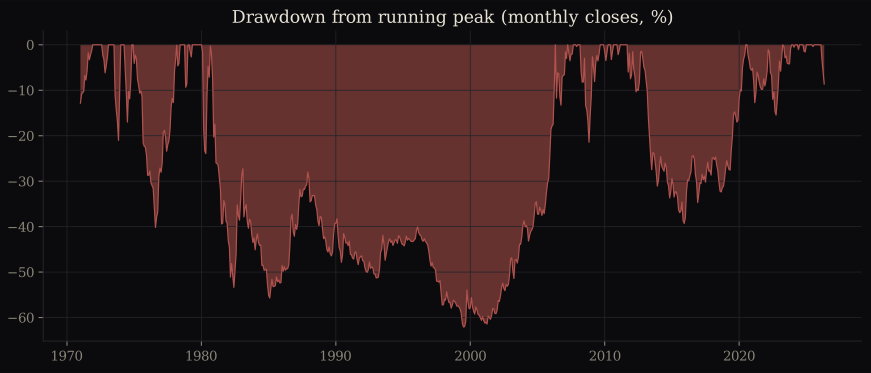
Three regularities survive across all six regimes. First, gold's bulls are monetary-credibility events, not inflation events per se. The 1970s, the 2000s and the 2020s each began with a credible challenge to the dollar-centric arrangement — Nixon closing the window, the Fed reflating serial bubbles, and the weaponization of reserves in 2022. Inflation alone (e.g. 1988–91) moved gold little. Second, the drawdowns are long and deep — the chart below shows −70% (1980s–90s) and −45% (2011–15); a 20–25% correction like the current one is routine inside ongoing bulls (1975–76: −44% mid-bull, then ×8). Third, each bull's marginal buyer is different — 1970s: Western retail and OPEC; 2000s: Western ETFs; 2020s: central banks and Asian households[2]. Diagnose the marginal buyer correctly and the regime usually follows.
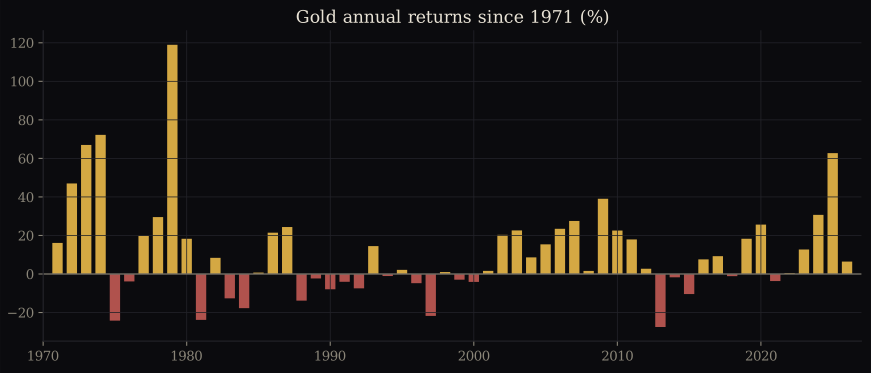
Annual returns since 1971
Positive in ~60% of years; fat tails on both sides
Drawdowns from running peak
The price of holding gold: multi-decade underwater periods
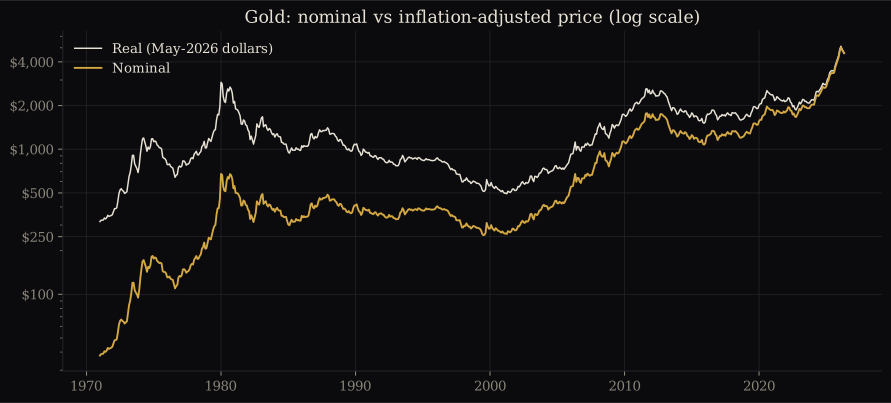
Nominal vs inflation-adjusted price
In May-2026 dollars. The Jan 2026 peak decisively exceeded the 1980 real-terms record — the first regime to do so.
The present regime, up close
2022 → now, in market prices
The current leg is best read on the trading chart: a grinding 2022–23 base under $2,100, acceleration through 2024–25 as central-bank buying compounded with Western ETF re-entry, the blow-off to $5,405 in January 2026, and a ~25% correction to ~$4,100 that began in late March[3][4]. Note what the correction looks like in context — on the 15-year view it barely registers as a wiggle on a curve that quadrupled in four years.
XAUUSD — trading view
Live broker data (MT5/FTMO) · switch ranges
+74.0% over 2Y
Daily closes · MetaTrader 5 (FTMO) · last bar 2026-06-11 $4,091.39
1980 top → breakeven
27 yrs
Nominal terms; never in real terms until 2008
Mid-bull 1975–76 dip
−44%
Then ×8 to the 1980 top — corrections ≠ regime ends
2022→2026 move
×2.8
$1,900 → $5,405 peak in four years
Current correction
−24%
$5,405 → $4,091, Jan 28 → Jun 11 2026
Sources & citations